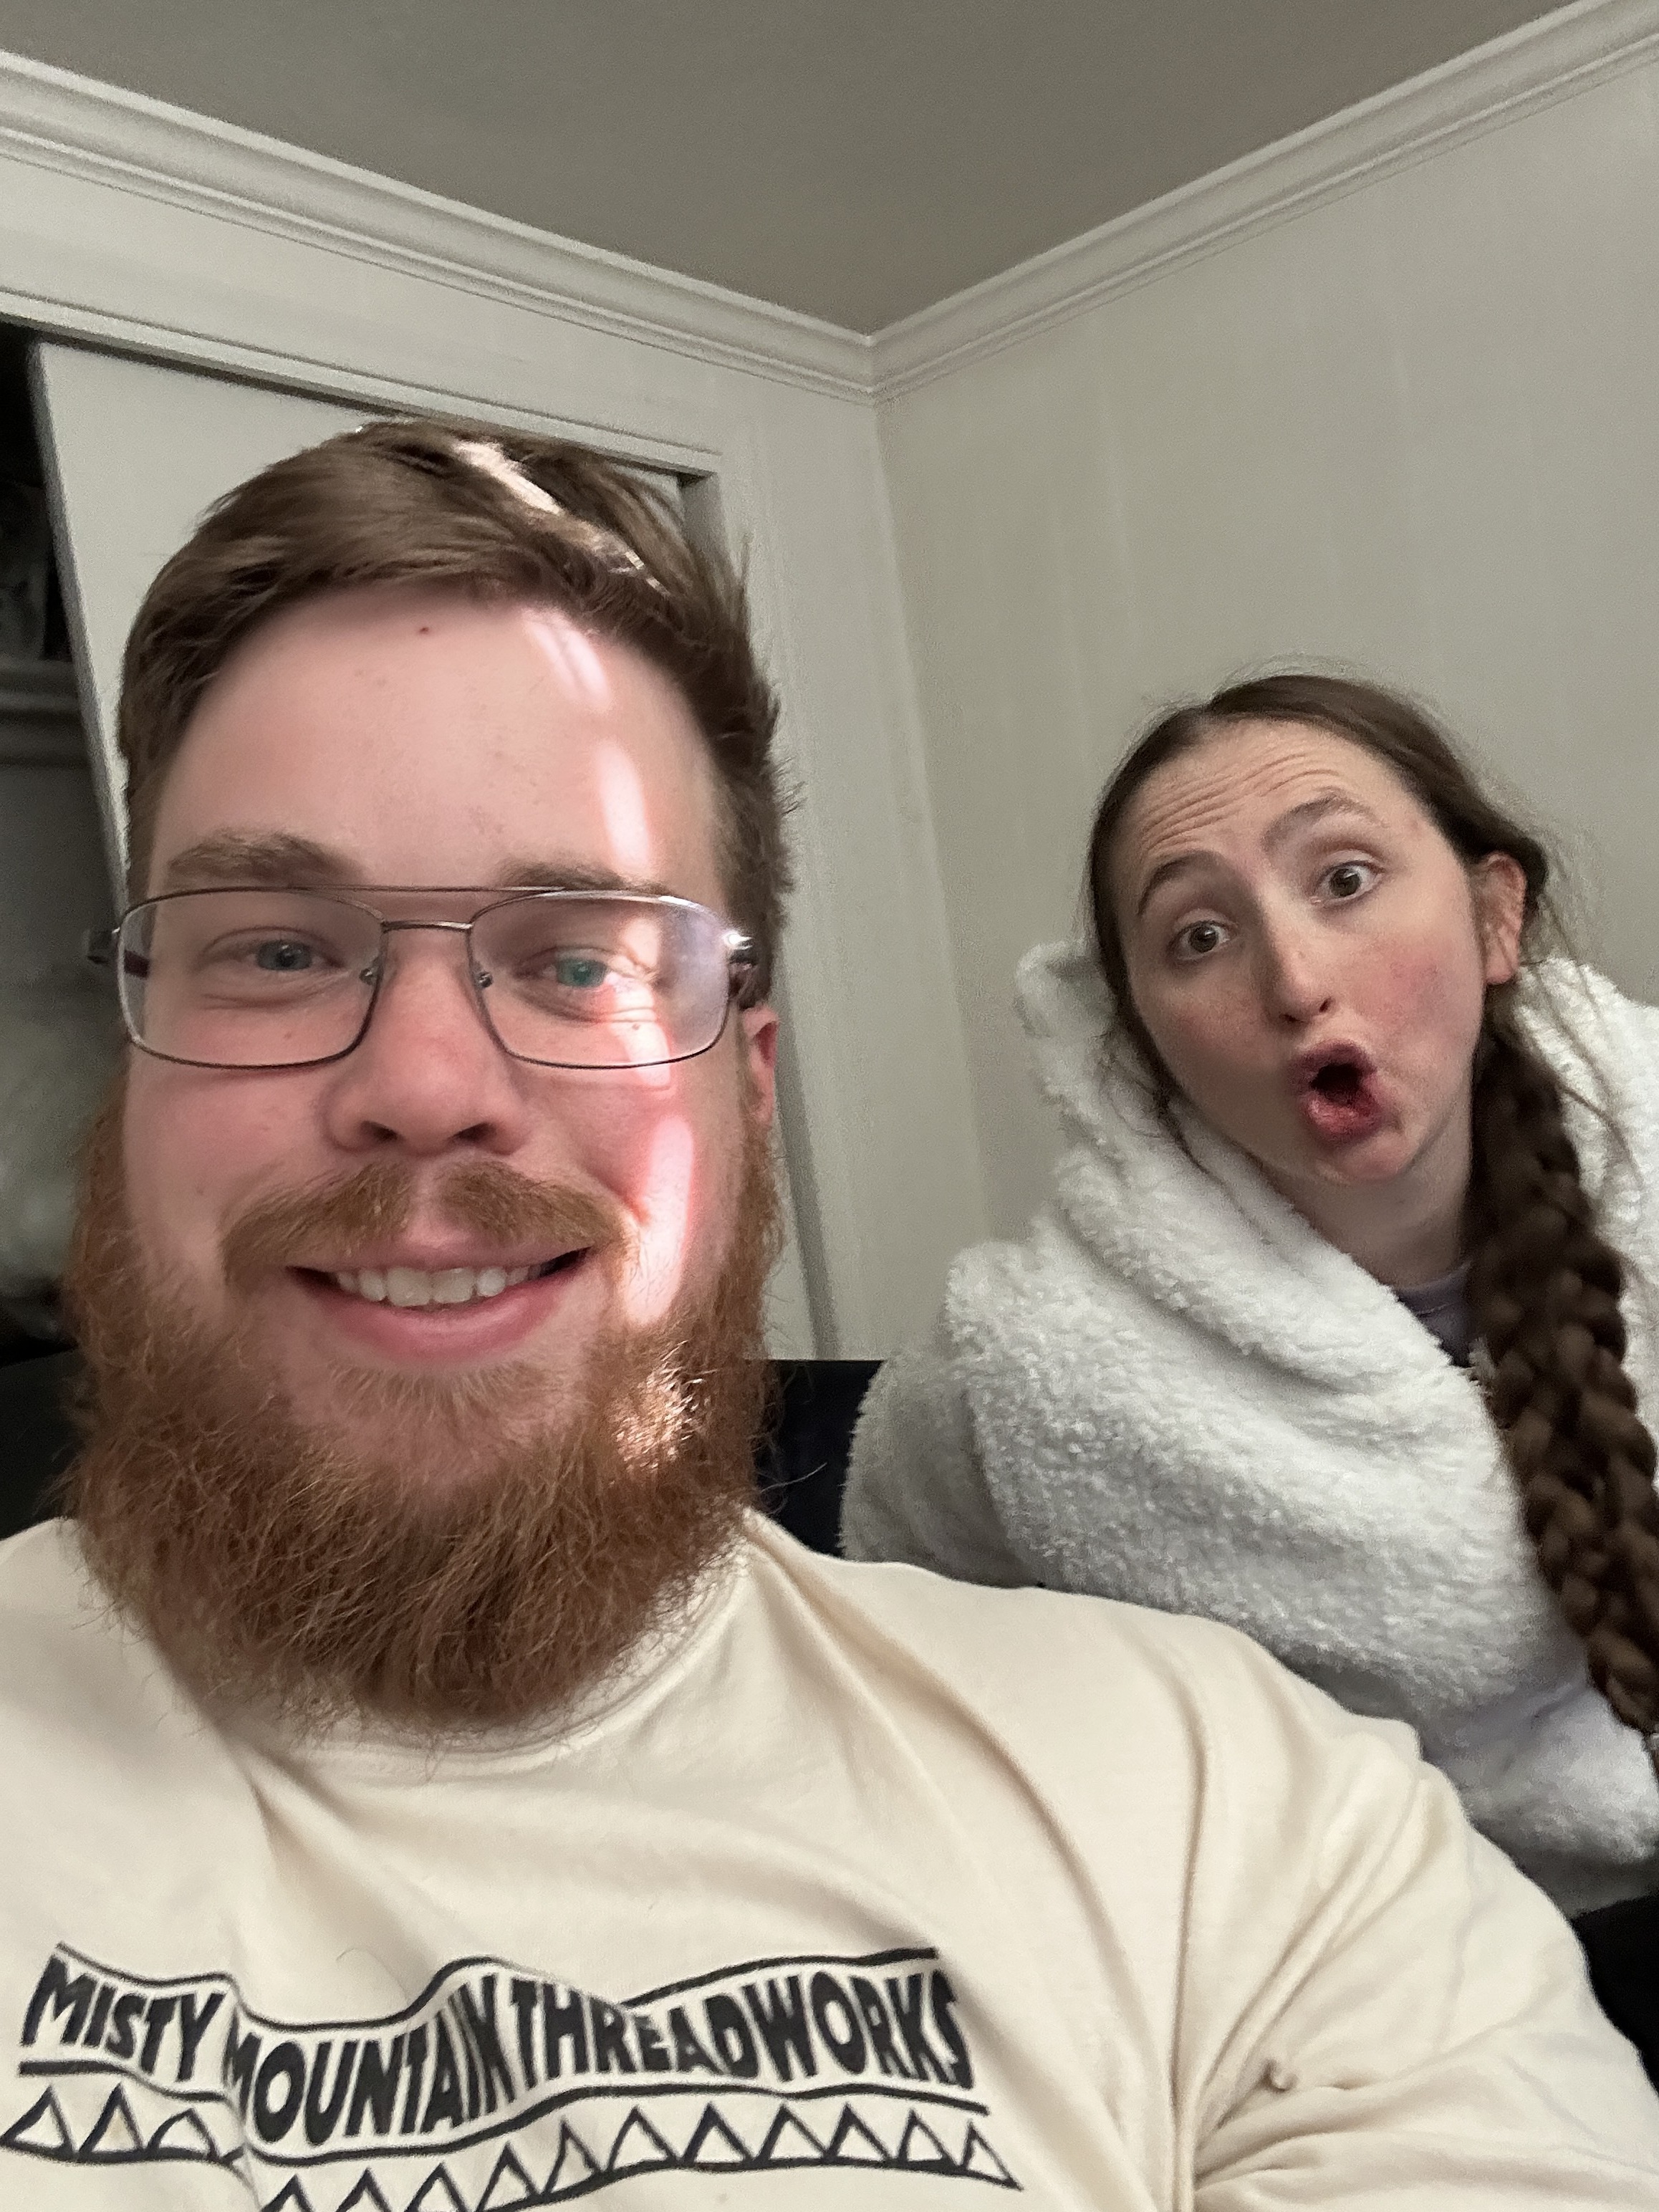
David Bean
Biomedical Informatics · Data Science · AI
I'm a data scientist with a Master's in Biomedical Informatics (Data Science and AI emphasis) from the University of Utah, where my research centered on cancer genomics. The pipelines I built took raw DNA sequencing data through to verified somatic mutations, the basis for more personalized cancer treatment. I worked on tumor-only samples, a technically challenging case where there's no matched healthy tissue to compare against, so the mutations a patient was born with have to be filtered out against population databases instead.
Reporting findings clearly matters as much as the rigor behind them. That starts with knowing your audience and giving them a reason to care. A good figure carries ideas that plain language can't reach. I'm an artist outside of work, mostly digital and pyrography, which is how I've developed a design sense that informs every figure I create. Presenting to domain experts taught me precision and rigor in reporting, while teaching taught me how to make complex topics clear and interesting to people outside the field.